Figures for the LC pathways
The figures of the pathway question
(lc_pathways),
for the right-hemisphere cells of the types of interest.
A partner is a strong partner
(strong_set of lc_output_strength),
and the figures take their partner tables from lc_pathways.
census = load_census()
sides = load_visual_types().select("root_id", "side")
proofread_ids = load_proofread_ids()
cells = cells_of_types(census, sides, TYPES_OF_INTEREST)
_scored = [_id for _ids in cells.values() for _id in _ids]
connections = with_pre_type(load_connections_of(_scored), cells)
input_connections = with_pre_type(
    reversed_connections(load_connections_of(_scored, end="post")), cells
)
strong_out = strong_set(
    labeled_partners(connections, cells, census, proofread_ids)
)
strong_in = strong_set(
    labeled_partners(input_connections, cells, census, proofread_ids)
)
Partner overlap
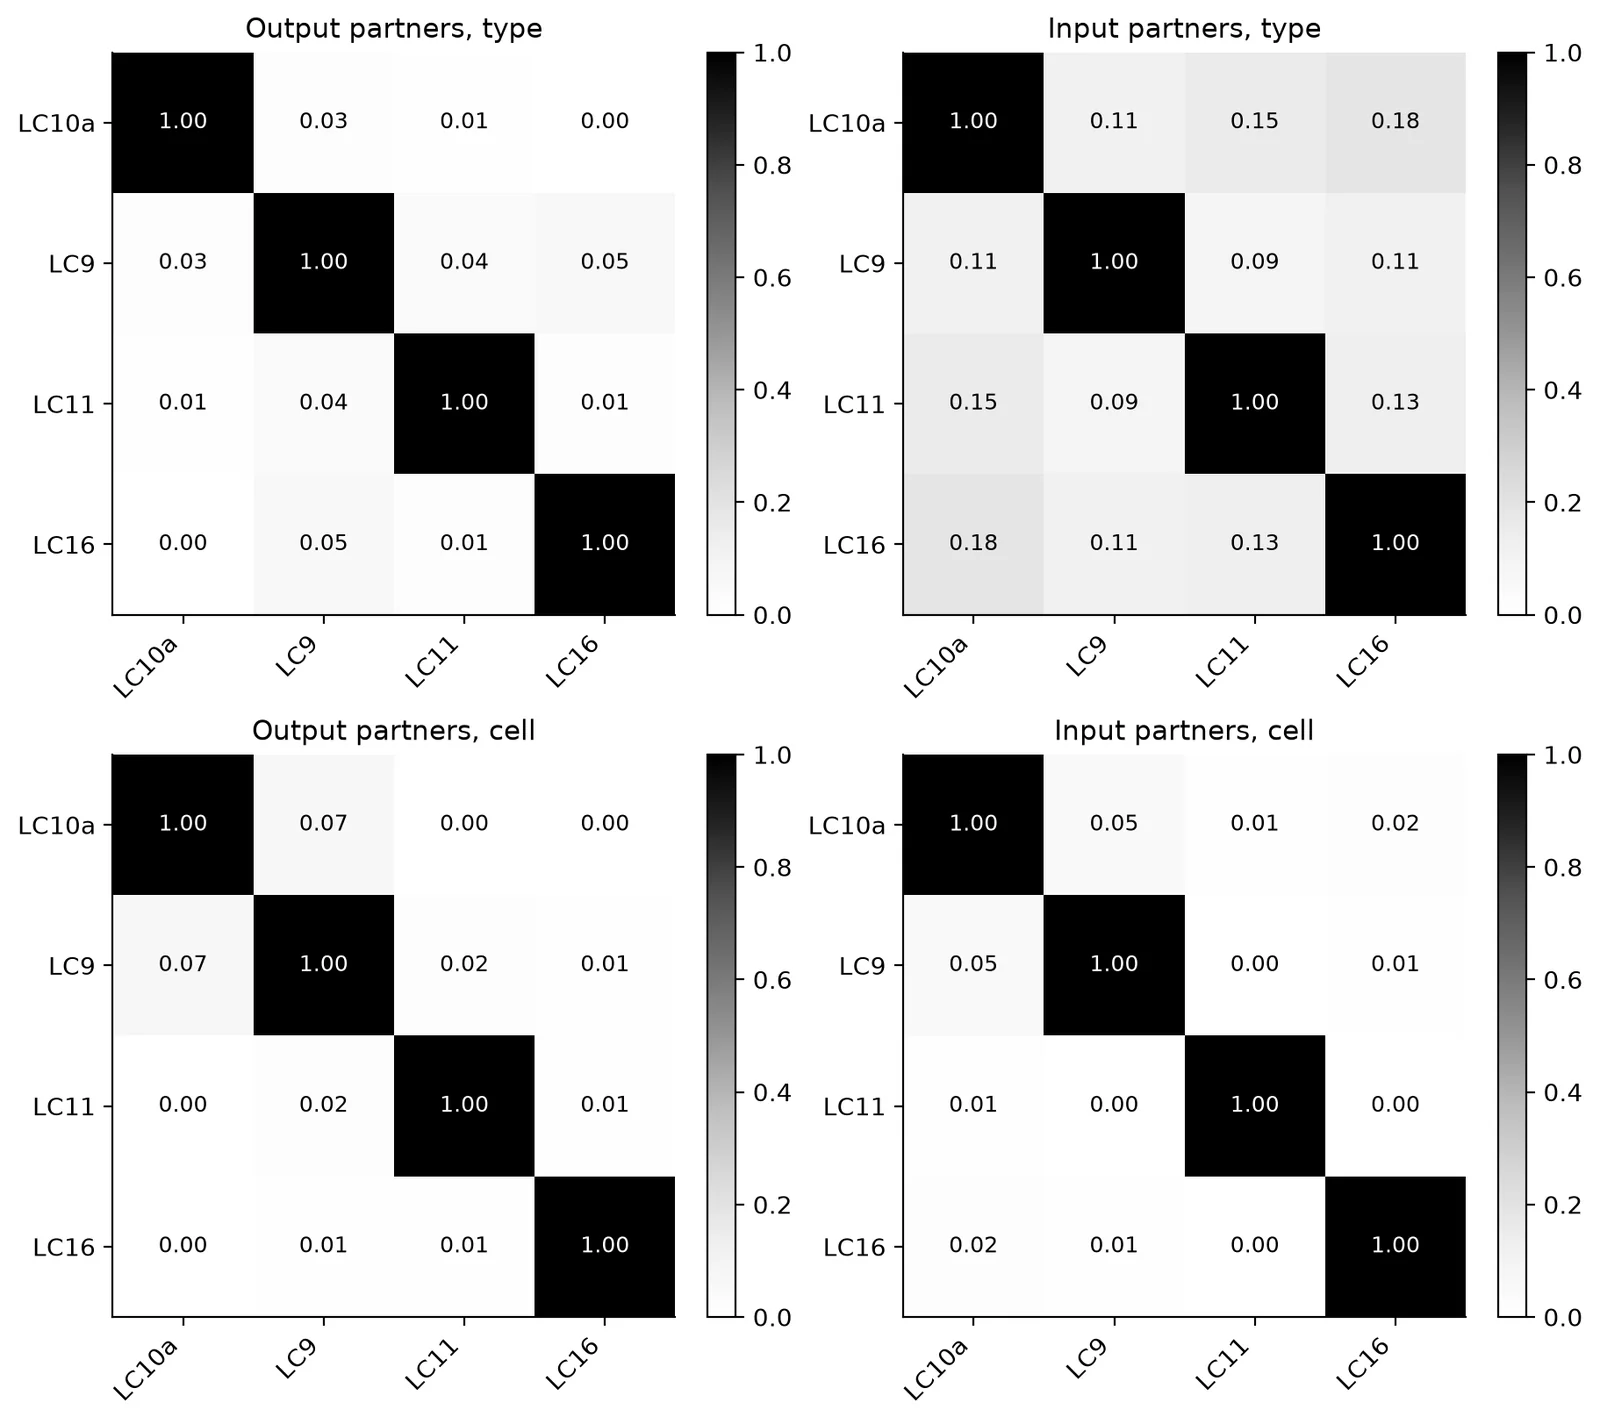
Four heatmaps of the Jaccard index of the strong partners of two
types, for the type and the cell level, outputs and inputs.
1 is the same set and 0 is disjoint.
The cell-level output panel is Dr. Chiappe's convergence test.
jaccard_matrix turns the pairs into a symmetric matrix with 1 on
the diagonal.
def jaccard_matrix(pairs: pl.DataFrame, types: Sequence[str]) -> np.ndarray:
    """The Jaccard index of every pair of types as a symmetric matrix
    with 1 on the diagonal, in the order of types.

    pairs is DataFrame[a, b, jaccard], one row per pair.
    """
    position = {t: n for n, t in enumerate(types)}
    matrix = np.eye(len(types))
    for row in pairs.iter_rows(named=True):
        i, j = position[row["a"]], position[row["b"]]
        matrix[i, j] = matrix[j, i] = row["jaccard"]
    return matrix
def jaccard_heatmaps(
    panels: dict[str, np.ndarray], types: Sequence[str]
) -> Figure:
    """A 2 x 2 figure of titled Jaccard matrices, shaded from 0 to 1."""
    fig, axes = plt.subplots(2, 2, figsize=(9, 8))
    for ax, (title, matrix) in zip(axes.ravel(), panels.items(), strict=True):
        image = ax.imshow(matrix, vmin=0, vmax=1, cmap="Greys")
        ax.set_xticks(range(len(types)), types, rotation=45, ha="right")
        ax.set_yticks(range(len(types)), types)
        ax.set_title(title, fontsize=11)
        for i in range(len(types)):
            for j in range(len(types)):
                # Dark text on light cells and white on dark ones;
                # 0.55 is where the shading crosses mid-gray.
                ink = "white" if matrix[i, j] >= 0.55 else "black"
                ax.text(
                    j,
                    i,
                    f"{matrix[i, j]:.2f}",
                    ha="center",
                    va="center",
                    color=ink,
                    fontsize=9,
                )
        fig.colorbar(image, ax=ax, fraction=0.046)
    return fig
_named = pl.col("partner_type") != "untyped neuron"
_panels = {
    "Output partners, type": jaccard_matrix(
        pairwise_jaccard(
            sets_by_type(
                strong_out.filter(_named),
                "partner_type",
                TYPES_OF_INTEREST,
            )
        ),
        TYPES_OF_INTEREST,
    ),
    "Input partners, type": jaccard_matrix(
        pairwise_jaccard(
            sets_by_type(
                strong_in.filter(_named),
                "partner_type",
                TYPES_OF_INTEREST,
            )
        ),
        TYPES_OF_INTEREST,
    ),
    "Output partners, cell": jaccard_matrix(
        pairwise_jaccard(
            sets_by_type(strong_out, "partner", TYPES_OF_INTEREST)
        ),
        TYPES_OF_INTEREST,
    ),
    "Input partners, cell": jaccard_matrix(
        pairwise_jaccard(
            sets_by_type(strong_in, "partner", TYPES_OF_INTEREST)
        ),
        TYPES_OF_INTEREST,
    ),
}
_fig = jaccard_heatmaps(_panels, TYPES_OF_INTEREST)
_fig.savefig(figure_path("lc4_partner_jaccard.png"), dpi=150)
_fig
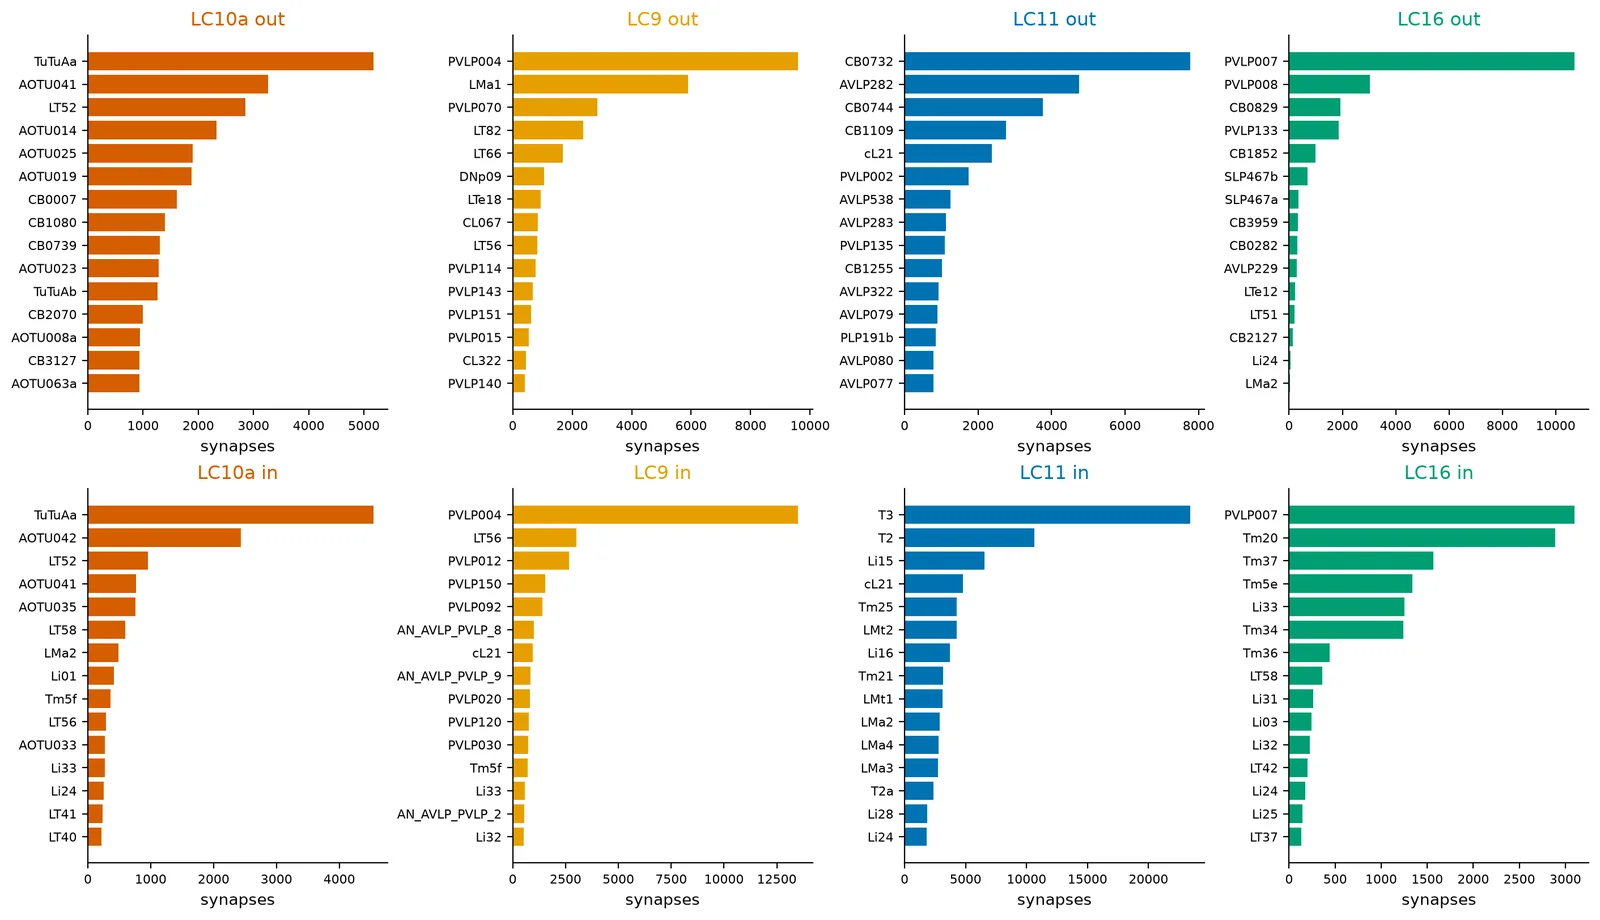
Top partner types
Bars instead of a network:
each LC type's heaviest output (top row) and input (bottom row)
partner types, by the synapses it exchanges with their strong
partners.
top_partners_figure draws them in the color of the LC type.
def top_partners_figure(
    out_mass: pl.DataFrame,
    in_mass: pl.DataFrame,
    types: Sequence[str],
    *,
    shown: int = TOP_PARTNERS_SHOWN,
) -> Figure:
    """Horizontal bars of the heaviest partner types of each type, the
    outputs in the top row and the inputs in the bottom one.

    out_mass and in_mass are DataFrame[type, partner_type, synapses],
    as type_mass returns them; shown is the number of bars per panel.
    """
    fig, axes = plt.subplots(2, len(types), figsize=(14, 8))
    for col, t in enumerate(types):
        for row, (mass, direction) in enumerate(
            [(out_mass, "out"), (in_mass, "in")]
        ):
            ax = axes[row][col]
            top = (
                mass.filter(pl.col("type") == t)
                .sort("synapses", descending=True)
                .head(shown)
                .sort("synapses")
            )
            ax.barh(top["partner_type"], top["synapses"], color=TYPE_COLORS[t])
            ax.set_title(f"{t} {direction}", color=TYPE_COLORS[t])
            ax.tick_params(labelsize=8)
            ax.set_xlabel("synapses")
    return fig
_fig = top_partners_figure(
    type_mass(strong_out), type_mass(strong_in), TYPES_OF_INTEREST
)
_fig.savefig(figure_path("lc4_top_partners.png"), dpi=150)
_fig
Network
The LC types, each type's NET_TOP_PER_TYPE heaviest partner types
(outputs and inputs together),
and the lateral connections between the LC types.
Partner-to-partner edges are left out on purpose.
An edge's width is its synapse count;
one color leaves an LC type, another enters one,
and gray is lateral.
network_edges picks the edges.
def network_edges(
    out_mass: pl.DataFrame,
    in_mass: pl.DataFrame,
    lateral: pl.DataFrame,
    *,
    top_per_type: int = NET_TOP_PER_TYPE,
    min_synapses: int = NET_MIN_SYN,
) -> pl.DataFrame:
    """The edges of the network: the lateral ones, and those to the
    heaviest partner types of each type.

    out_mass and in_mass are DataFrame[type, partner_type, synapses],
    as type_mass returns them, and lateral is DataFrame[pre_type,
    post_type, synapses], as lateral_synapses returns it.
    A partner type is kept when it is among the top_per_type of its LC
    type by its synapses in both directions together; an edge needs at
    least min_synapses.
    DataFrame[src, dst, synapses, kind]; kind is "out", "in", or
    "lateral".
    """
    outputs = out_mass.select(
        src="type", dst="partner_type", synapses="synapses", kind=pl.lit("out")
    )
    inputs = in_mass.select(
        src="partner_type", dst="type", synapses="synapses", kind=pl.lit("in")
    )
    both = pl.concat(
        [
            outputs.with_columns(type=pl.col("src"), partner=pl.col("dst")),
            inputs.with_columns(type=pl.col("dst"), partner=pl.col("src")),
        ]
    )
    top = (
        both.group_by("type", "partner")
        .agg(pl.col("synapses").sum())
        .sort("synapses", descending=True)
        .group_by("type", maintain_order=True)
        .head(top_per_type)
        .select("type", "partner")
    )
    kept = both.join(top, on=["type", "partner"]).select(
        "src", "dst", "synapses", "kind"
    )
    lateral_edges = lateral.filter(
        pl.col("pre_type") != pl.col("post_type")
    ).select(
        src="pre_type",
        dst="post_type",
        synapses="synapses",
        kind=pl.lit("lateral"),
    )
    return pl.concat([lateral_edges, kept]).filter(
        pl.col("synapses") >= min_synapses
    )
net_edges = network_edges(
    type_mass(strong_out),
    type_mass(strong_in),
    lateral_synapses(
        with_post_type(connections, cells), TYPES_OF_INTEREST
    ),
)
net_edges
| src | dst | synapses | kind |
|---|---|---|---|
| str | str | i64 | str |
| "LC10a" | "LC9" | 561 | "lateral" |
| "LC9" | "LC10a" | 2853 | "lateral" |
| "LC9" | "LC11" | 295 | "lateral" |
| "LC9" | "LC16" | 93 | "lateral" |
| "LC11" | "LC10a" | 596 | "lateral" |
| … | … | … | … |
| "Tm20" | "LC16" | 2892 | "in" |
| "PVLP004" | "LC9" | 13513 | "in" |
| "LT56" | "LC9" | 3002 | "in" |
| "PVLP012" | "LC9" | 2674 | "in" |
| "PVLP070" | "LC9" | 374 | "in" |
network_figure draws them as an interactive network:
LC types in their colors, partner types in gray.
def network_figure(edges: pl.DataFrame, types: Sequence[str]) -> Network:
    """A pyvis Network of the edges, with the LC types in TYPE_COLORS,
    the partner types in gray, and each edge in the color of its kind.

    edges is DataFrame[src, dst, synapses, kind].
    """
    net = Network(
        height="560px",
        width="100%",
        directed=True,
        cdn_resources="in_line",
    )
    net.barnes_hut(gravity=-12000, spring_length=220, central_gravity=0.25)
    for name in types:
        net.add_node(
            name, label=name, color=TYPE_COLORS[name], size=40, borderWidth=2
        )
    partners = (set(edges["src"]) | set(edges["dst"])) - set(types)
    for name in sorted(partners):
        net.add_node(name, label=name, color=CONTEXT_COLOR, size=16)
    colors = {
        "out": DIRECTION_COLORS["out"],
        "in": DIRECTION_COLORS["in"],
        "lateral": CONTEXT_COLOR,
    }
    for row in edges.iter_rows(named=True):
        # The width in pixels grows by one for every 300 synapses and is
        # clamped, so weak edges stay visible and strong ones do not
        # swamp the plot.
        width = max(1.5, min(8.0, row["synapses"] / 300))
        net.add_edge(
            row["src"],
            row["dst"],
            width=width,
            color=colors[row["kind"]],
            title=f"{row['kind']} {row['synapses']} synapses",
        )
    return net
_net = network_figure(net_edges, TYPES_OF_INTEREST)
_net.write_html(
    str(figure_path("lc4_network.html")),
    open_browser=False,
    notebook=False,
)
mo.iframe(_net.generate_html(), height="600px")