look
The colors and plotting defaults that every figure shares,
so a type has one color everywhere.
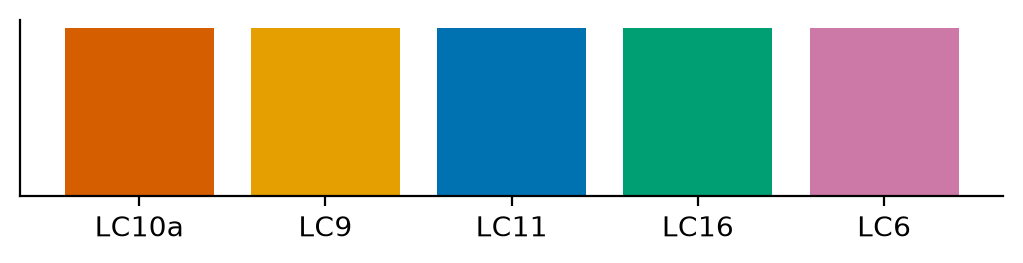
TYPE_COLORS gives each LC type its color,
DIRECTION_COLORS the colors of inputs and outputs,
and CONTEXT_COLOR the gray of whatever is not the point.
Each one below has a small demo.
use_base_look sets the matplotlib defaults
(the color cycle follows TYPE_COLORS, no top and right spines,
no legend frame, constrained layout)
and an altair theme, lab, with the same colors.
A notebook calls it once in its setup,
so a plot states a color, size, or line width only when its data
need it.
def use_base_look() -> None:
    """Set the matplotlib defaults and enable the altair theme "lab"."""
    plt.rcParams.update(
        {
            "axes.prop_cycle": cycler(color=list(TYPE_COLORS.values())),
            "axes.spines.top": False,
            "axes.spines.right": False,
            "legend.frameon": False,
            "figure.constrained_layout.use": True,
        }
    )

    @alt.theme.register("lab", enable=True)
    def lab_theme() -> alt.theme.ThemeConfig:
        return alt.theme.ThemeConfig(
            {
                "config": {
                    "view": {"stroke": "transparent"},
                    "range": {"category": list(TYPE_COLORS.values())},
                }
            }
        )
use_base_look()
_fig, _ax = plt.subplots(figsize=(5, 1.2))
_ax.bar(list(TYPE_COLORS), 1, color=list(TYPE_COLORS.values()))
_ax.set_yticks([])
_fig
altair gives categories its colors in alphabetical order,
which would not match the matplotlib figures.
type_color is the encoding that colors a field of types by
TYPE_COLORS, with no legend:
def type_color(field: str = "type") -> alt.Color:
    """An altair color encoding that gives each type of the nominal
    column field its color in TYPE_COLORS."""
    return alt.Color(
        f"{field}:N",
        scale=alt.Scale(
            domain=list(TYPE_COLORS), range=list(TYPE_COLORS.values())
        ),
        legend=None,
    )
alt.Chart(
    alt.Data(
        values=[
            {"type": _t, "cells": _n}
            for _n, _t in enumerate(TYPE_COLORS, start=1)
        ]
    )
).mark_bar().encode(
    y=alt.Y("type:N", sort=list(TYPE_COLORS), title=None),
    x="cells:Q",
    color=type_color(),
).properties(width=200, height=100)